MTD, QTD, and YTD values explained

- Blog
- Tech Talk
Are you trying to find a reliable way to figure out how to answer vital business questions and establish trends over time?
For example, how many people used a certain service so far this year, compared to the same point last year? How have sales figures grown month by month? How your costs this quarter compared to those in the same chunk of the same quarter in previous years?
To drill down into this information, you’ll need to make proper use of MTD, QTD, and YTD values in your BI platform.
But before I show you how to do that, let me explain what we mean by each of those terms.
What is MTD?
MTD stands for “month to date.” It’s the period starting from the beginning of the current month up until now … but not including today’s date, because it might not be complete yet. You use MTD to give you information on a particular activity, results on a campaign, or so on, for this particular time period.
So if the date today is 20th July, MTD would cover activities/data during the time period from 1st July – 19th July, inclusive.
See how companies use AI to transform data.
Unlock a competitive edge by making analytics accessible and actionable for every user, technical or not.
Read the whitepaper
What is QTD?
QTD stands for “quarter to date.” It’s used in exactly the same way as MTD, except you’re looking at the time period from the start of this quarter until now. Be careful though: this can refer to either the calendar or the fiscal quarter.
What is YTD?
YTD stands for “year to date” — again, from the beginning of the current year, up to but not including today. Once again, make sure you know whether your company goes by the calendar year or the fiscal year, as the latter may not begin on January 1st.
Why are these useful?
Imagine, for example, that you work for a hospital that’s concerned it might be underresourced or understaffed to deal with demand this month and needs to work out whether to take action to bring in extra help.
To get a picture of whether this is correct, you could examine hospital performance and compare the number of hospital admissions you’ve had so far this month with the number of admissions you had by this point last month, to help you predict and prepare for your coming admission numbers.

How do I calculate MTD/QTD/YTD?
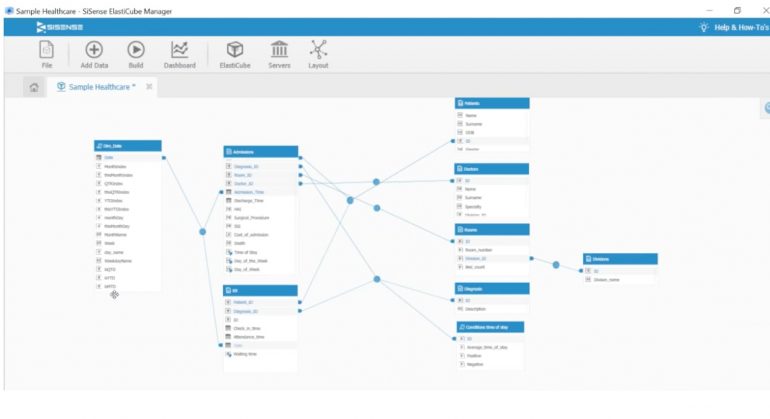
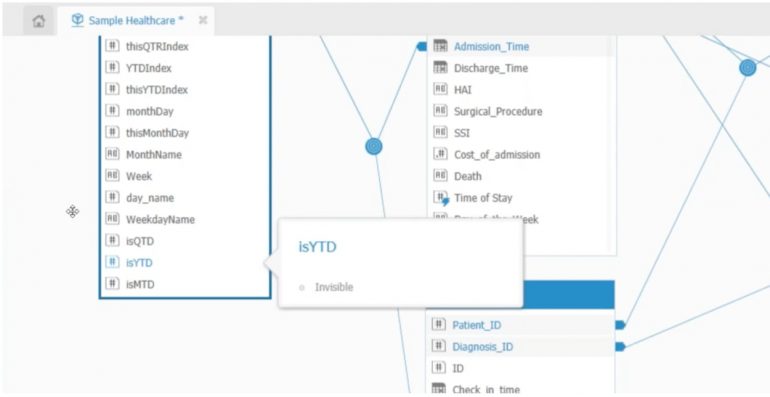
If you’re using Sisense to build a dashboard that can calculate this, you’d need to go into your Elasticube’s date dimension and select isMTD, isQTD, or isYTD, depending on the time period you want to compare.

Once you’ve flagged the definition you want, data that fits the description will get a “1,” while data that falls outside of this will get a “0.” Note that this uses the date dimension dm_date to generate your results.
This then selects only the dates from each quarter up to (not including) the current date that year. For example, If it was the 20th July today, this would only take into account activities from the 1st-19th July (inclusive) for every previous year, too.

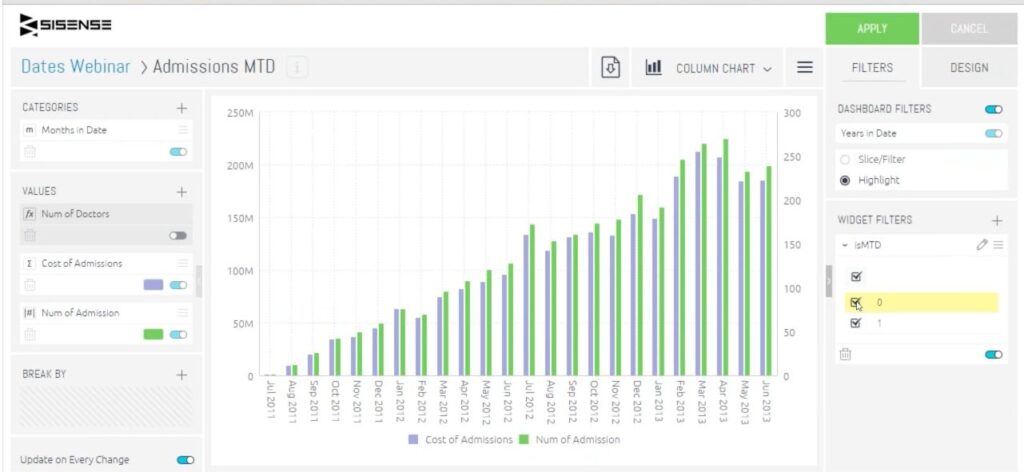
Below, you can see how that translates into a Sisense dashboard.
This graph shows a month-by-month comparison of the cost and number of admissions up to and including the current date (in this case, 20th July 2013).

As you can see, the “1” is unchecked and the “0” is unchecked, which means you are only looking at your MTD values for each of these months.
If you check both “0” and “1,” you get a picture of what the total figures for the month might rise to, to help you predict total admissions for the month:

While checking only “0” would show you dates outside of your month to date. That means there would be nothing for this month, but you would be able to see at a glance what proportion of admissions came after the 20th on previous months, too. This could prove vital in helping with your resource planning.
Final Thoughts
MTD, QTD, and YTD are all vital tools to help you identify trends and predict future behavior, requirements, or issues.
The kinds of questions you can answer with these calculations will help you do everything from spotting problems forming in real time, to canceling or putting in sales orders early, to figuring out when you need to allocate more resources to cope with growing demand.
By using these real-time functions, you can move away from retrospective analysis and get the insights you need in a timeframe that’s genuinely useful — you don’t have to wait for the current time period to end before you can assess the situation! This is crucial for your resource and financial planning, project management, and your bottom line.
See how Sisense helps teams deliver in-product analytics that drive engagement and scale with ease.
Watch a demo

Subscribe to the Sisense newsletter
Get monthly insights on building smarter products with AI-powered analytics, from industry trends to real Sisense use cases.


