Guide to composable analytics: Five critical capabilities
Introduction
Infusing your applications with analytics delivers transformative value. Because apps that are infused with analytics can increase user engagement. And that is a game changer for your users, customers, and company.
In fact, if you’re leading a product team, it’s one of the single most powerful ways to get real love from your users about your app. How? By providing users with relevant guidance on making better decisions at the point of decision. Put simply, it gives your users a rock-solid reason to use your app and stay using it.
And it can make great business sense too. For example, Harvard Business Review noted that “Products fueled by data and machine learning can be a powerful way to solve users’ needs. They can also create a “data moat” that can help stave off the competition.”
Analytics: great for your users, rocket fuel for your business
If you’re in the business of providing a commercial application or service, here’s where it gets really interesting. Building in analytics can:
- Improve competitive advantage
- Boost sales win rate
- Create upsell opportunities
- Increase customer retention, and reduce churn.
Generally, creating business cases is difficult. But with these kinds of benefits, it gets a lot easier. That said, there are some mistakes you’ve got to avoid.
Embedded analytics mistakes that you must avoid
Here’s the thing: Product and analytics delivery teams face a quandary. Building analytics into a user experience and workflows has typically come with some serious pitfalls.
For example, you’ll often see compromised experiences resulting from “force-fitting” a heavy-weight, off-the-shelf analytics platform into an app to get it to market faster. Development teams try to bend whole dashboards into the UX, and they end up looking and feeling completely different. It’s the very opposite of seamless. Not fun for your users to use, nor for your sales team to sell. And a real headache for product managers as they have to deal with the blowback.
Another common pitfall is in some way an inappropriate solution to the first one: development teams go in the complete opposite direction for maximum control. They’ll build every ounce of analytics functionality from the ground up, the query engine, visualizations, AI/ML. The whole lot. This crushes engineering productivity, and leaves them spending their whole time building analytics and less time in the rest of the product. It’s a velocity killer.
The better way: Composable development.
Fortunately, there’s a new way that gives you the benefit of starting from a base of analytics functionality, while also giving your development team total control. This means you can get to market fast, with analytics that feel exactly like your product.
Composable development is a software development approach that focuses on modular and reusable components, which can be combined and integrated to build new applications or functionality.
According to Gartner, “By 2025, 50% of enterprise buyers will transition from “build-versus-buy” sourcing strategies to embrace change-ready composable application suites.”
Composable development involves breaking down the architecture into smaller, simpler components with well-defined interfaces, allowing for flexibility and agility in development.
By adopting composable development practices, developers can:
- accelerate application development.
- achieve a more adaptable architecture.
- increase overall development efficiency.
Three benefits of composable development for analytics
Fast time-to-market. No user experience compromises.
There are several traditional ways to add analytics to a product or user experience. One option is to embed a traditional analytics platform and “bolt-on” the functionality into your app, embedding it as a separate analytics tab or using IFrame. While this option might be fast, it often sacrifices user experience, with analytics obviously “glued” into your product, with little developer control. Many embeddable analytics solutions fall into this category; they’re fast to integrate but ultimately provide a compromised user experience. They hurt user engagement because they have a different look and feel, which ultimately hurts adoption and success.
The other approach is to embed analytics deeply throughout the user workflows and tightly align it with the user experience. Often, teams approach this by building from the ground up, code-first, for total control over the experience, starting with an off-the-shelf charting component. But the problem is that engineering teams must build everything, from query management, ad hoc queries, reporting, data security, instrumentation, and even machine learning or GenAI analytics.
So, while it provides the user experience control developers want, they pay a heavy price, slowing down future innovation velocity and feature delivery.
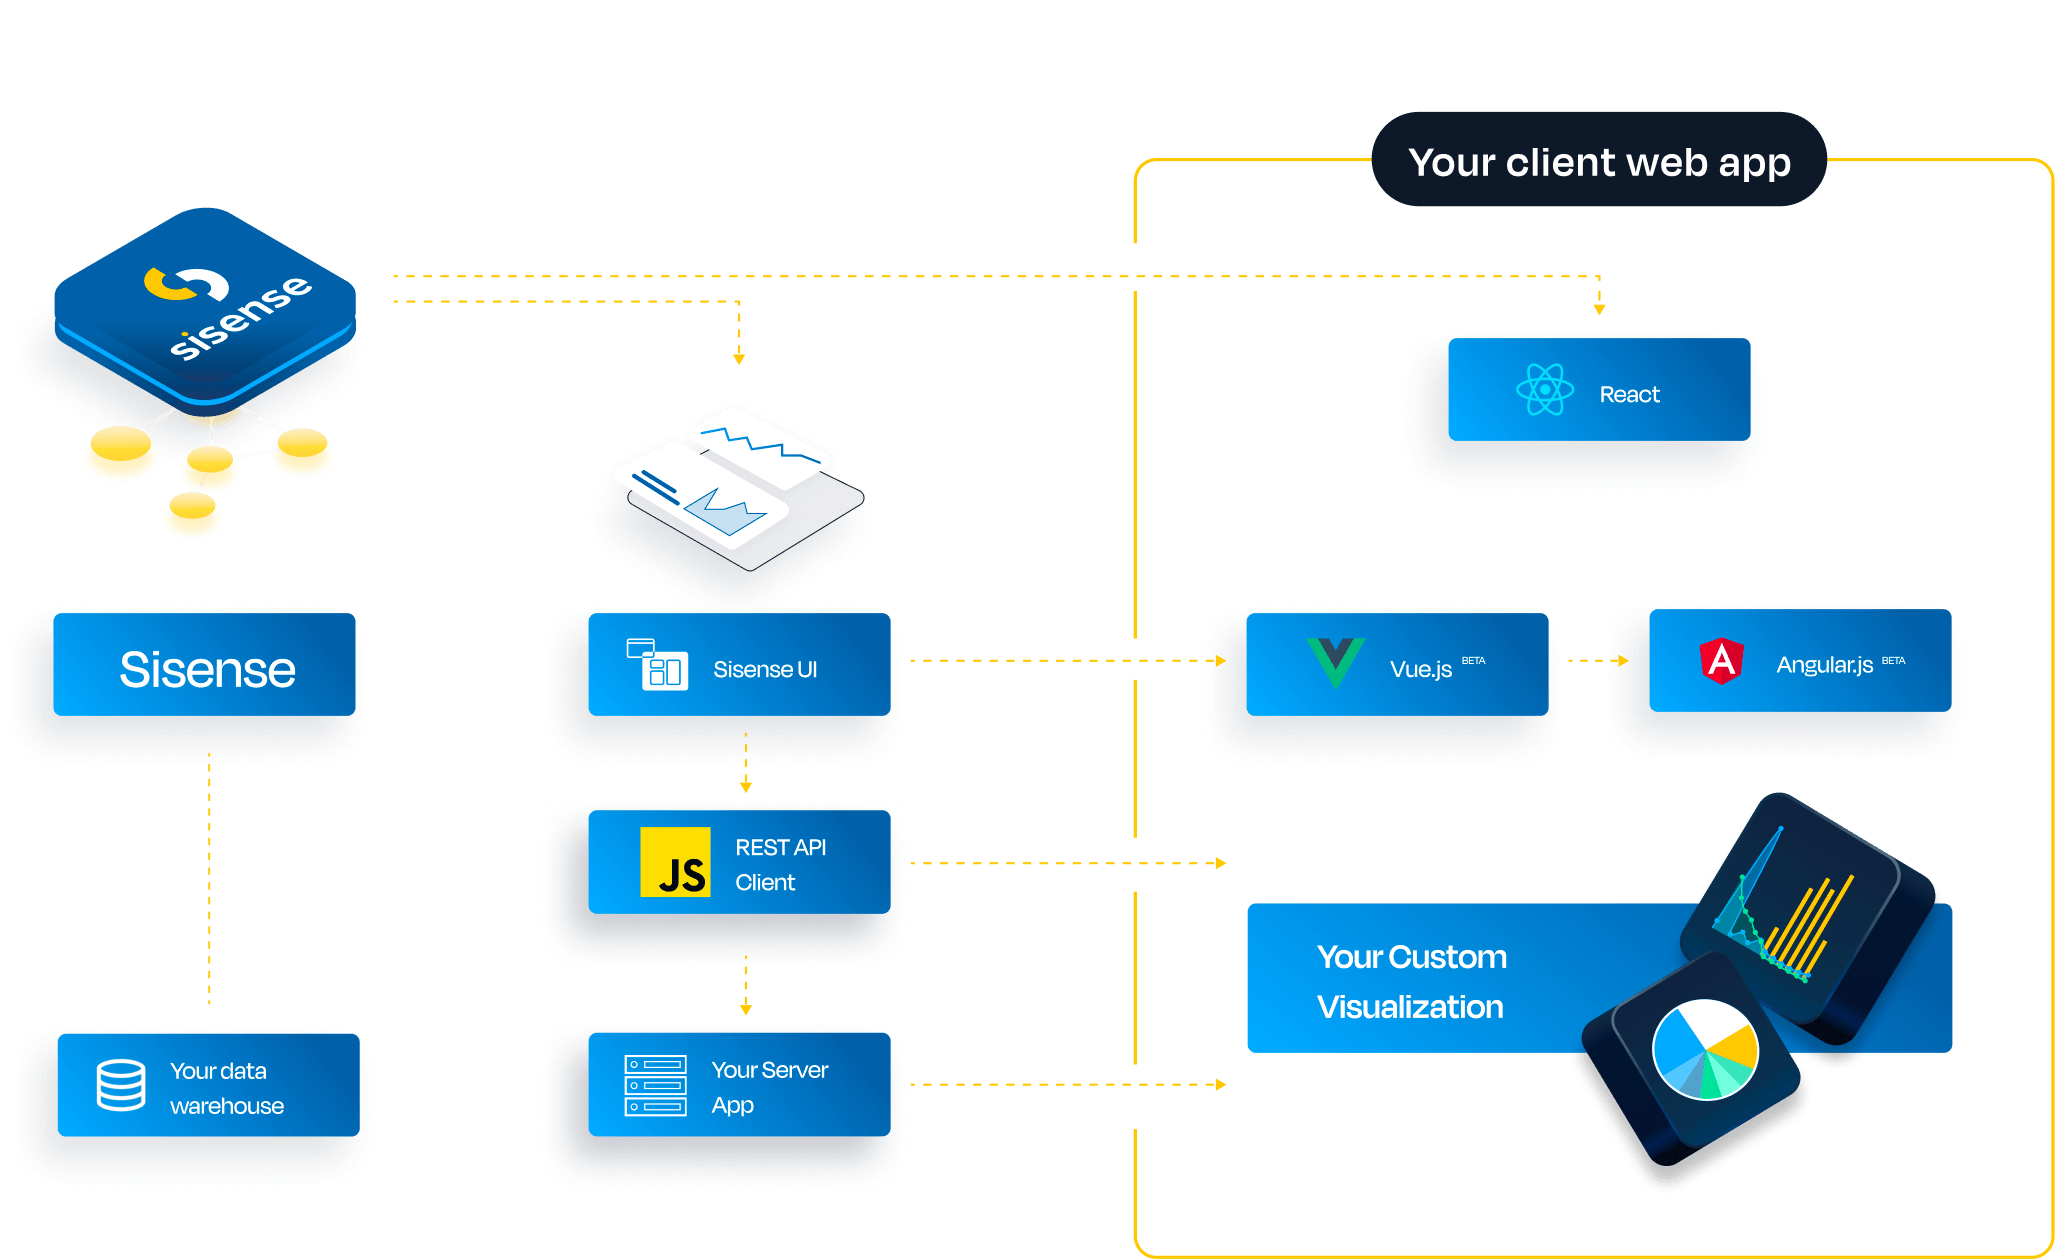
Composable analytics provides the best of both worlds. First, composable components are built on an analytics platform that provides a full suite of capabilities teams can use to accelerate delivery, from a semantic layer to query, slice, and dice, forecasting, GenAI chatbots, and more. On top of that, they provide granular and coarse-grained reusable UI components, libraries, and APIs for front-end engineering teams and a robust headless query layer, so there is no need to balance user experience with velocity.
Designed around how your product team works
Composable analytics enables organizations to integrate analytics capabilities directly into their existing applications or user workflows, eliminating the need to develop separate analytics solutions.
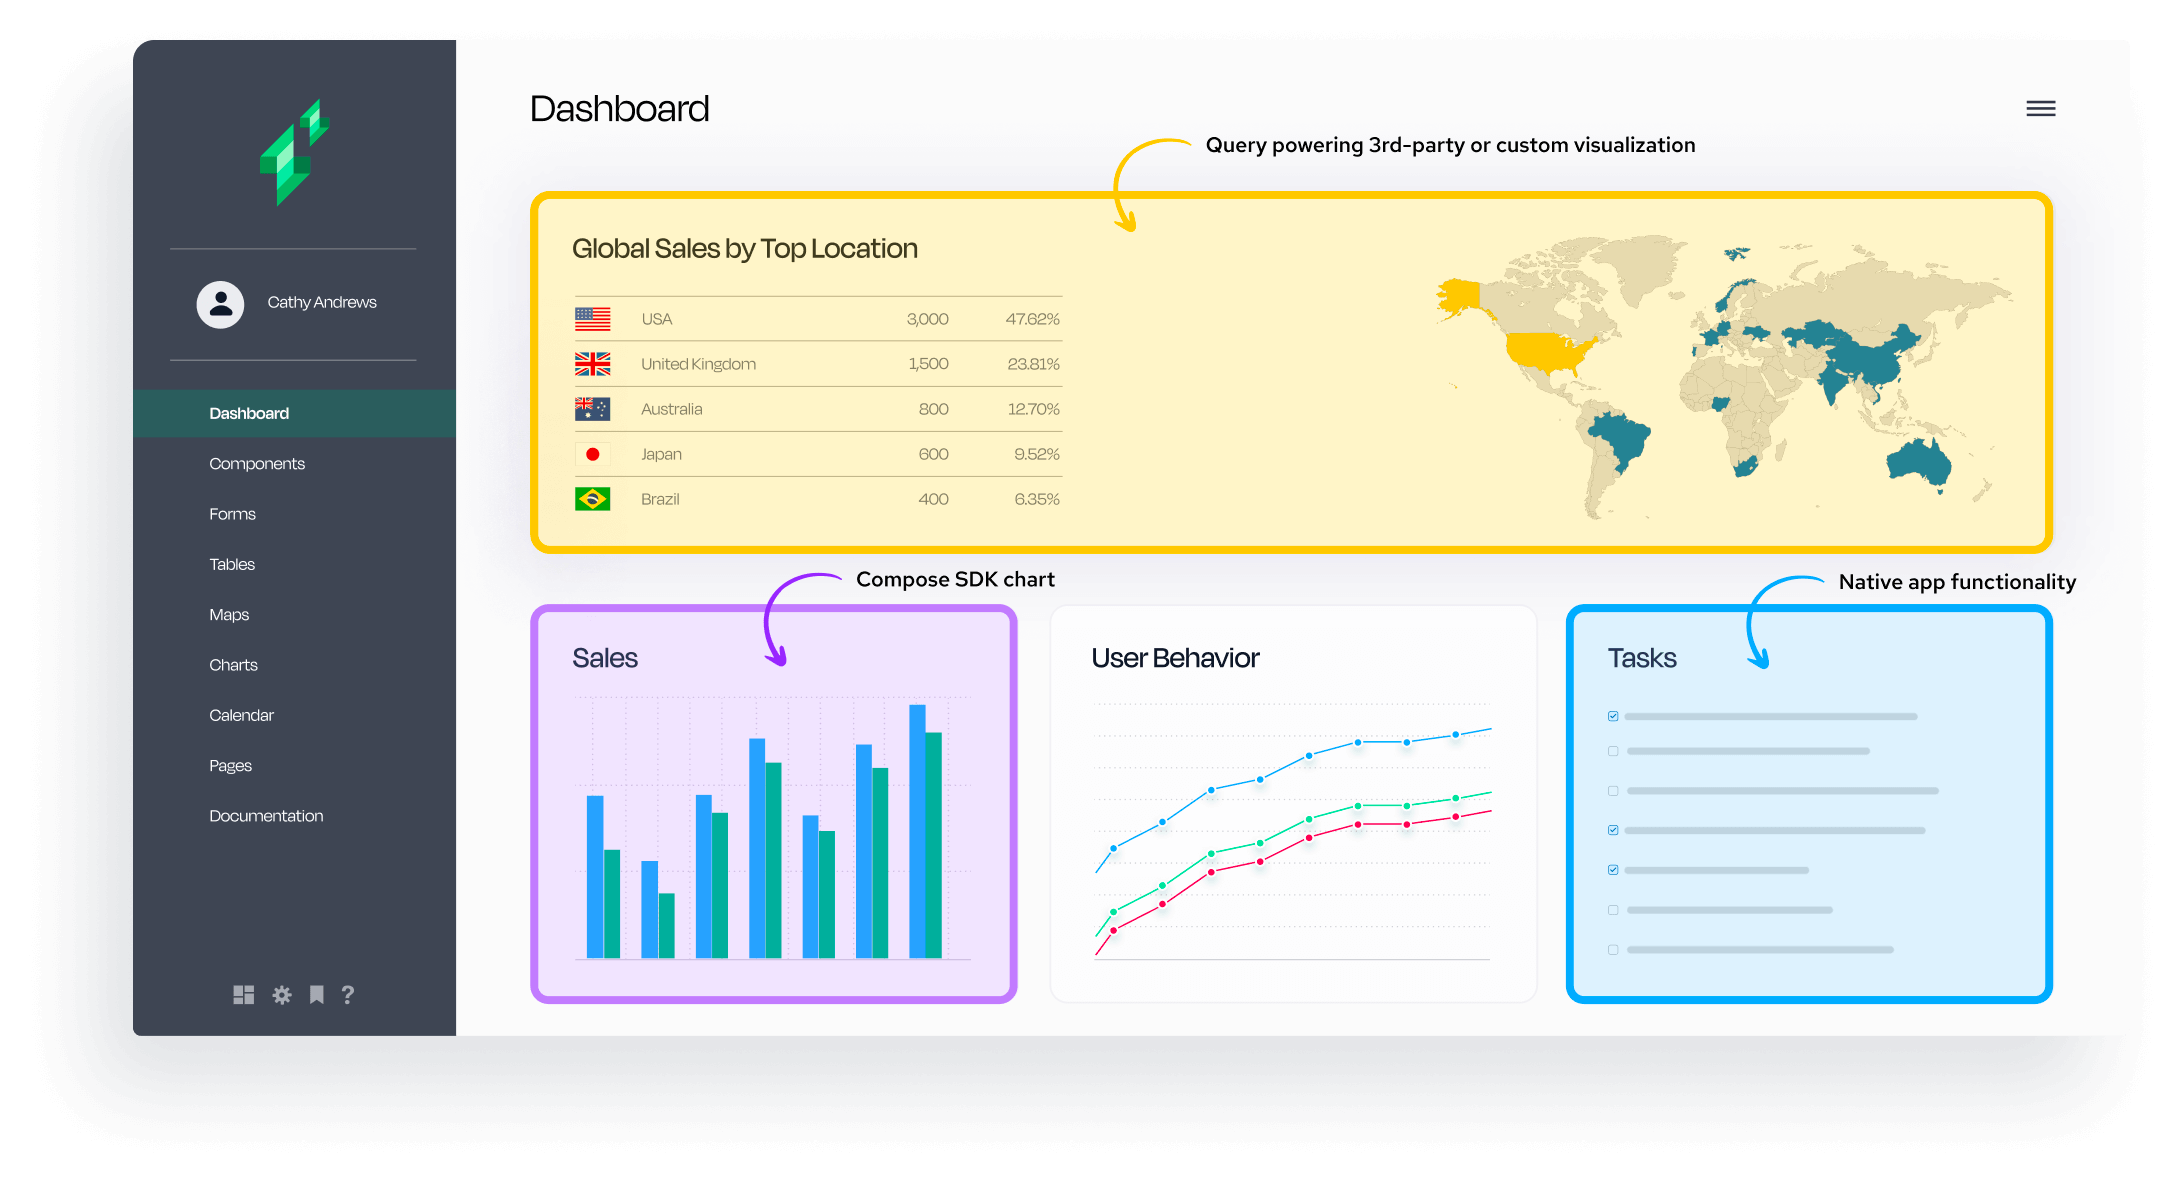
It’s an approach specifically designed for how modern analytics and product teams work. The data engineering and analytics teams use low-code or code-first methods to build and define the data model, metrics, analytics, and visualizations. The front-engineering team leverages it to compose code-first into their user experiences using an SDK for composable charts, queries, visualization, and UI components.
This approach allows businesses to quickly deliver analytics within their products without the time and effort required to build standalone analytics applications from scratch.

Less maintenance headaches and frustration.
When building and incorporating analytics, it is essential to prioritize performance, because even a slight delay in response times can lead to a loss of audience, performance plays a critical role in user engagement.
However, if you’re building from the ground up, or using open-source tooling, managing growing users, data volumes and complex queries can become increasingly time-consuming and challenging for your development team. Your team can get buried in query optimization that takes them away from other activities, not to mention needing better instrumentation to understand where and when the bottlenecks are occurring.
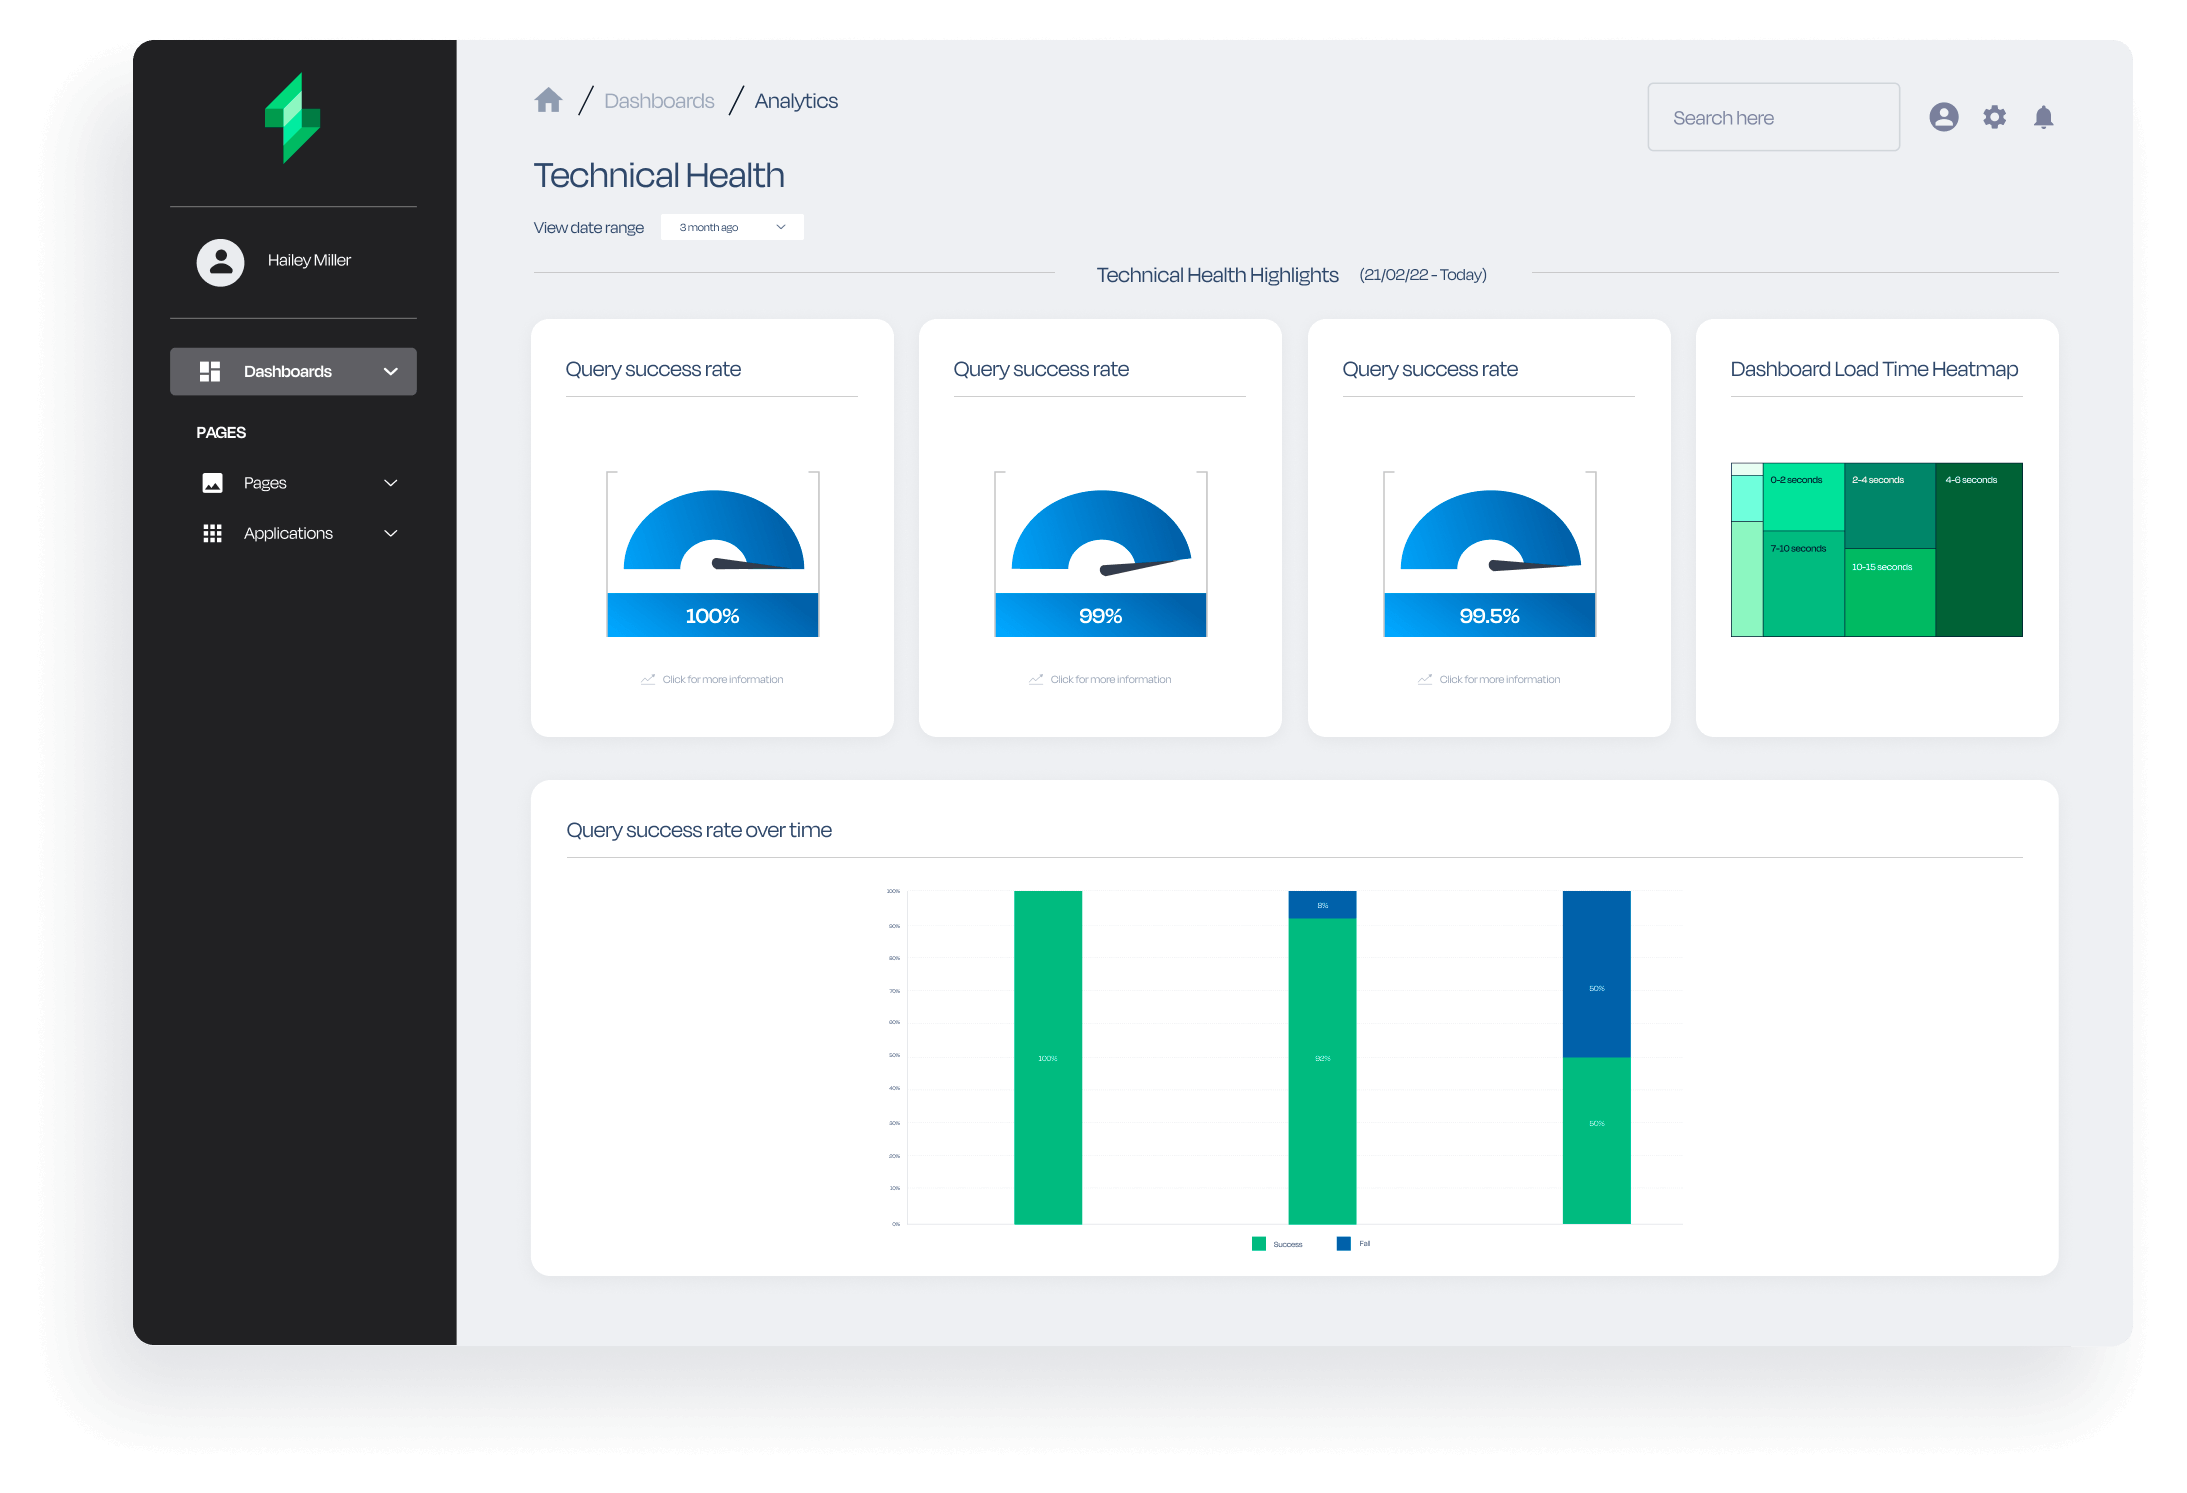
Composable analytics are built on an underlying data engine and platform that build-it-yourself or off-the-shelf charting components lack. Developers write queries against a semantic layer, which in turn are processed by a query engine that is optimized for performance, enabling faster and more efficient data retrieval, using indexing, caching, database-specific query optimization, and other strategies. And they often provide operational reporting, instrumentation, observability, and logging to ensure that developers can more quickly diagnose performance issues when they do occur, and make changes at a platform level rather than having to manually tune individual queries.
By using composable components, built on an underlying platform, your development team can focus on your product, rather than being dragged into operational management.
Five critical capabilities for composable analytics
Critical capability #1:
Supports modern front-end frameworks and languages
Your product team is undoubtedly familiar with mainstream UI frameworks, the most common being React, but Vue.js and Angular are growing in popularity.
- React: React is an open-source framework initially developed by Facebook. It is known for its simplicity and powerful features, such as a virtual Document Object Model (DOM), which enhances its functionality.
- Vue.js: Vue.js is a progressive JavaScript framework gaining in popularity among developers. It focuses on the view layer and offers a flexible and versatile approach to building user interfaces.
- Angular: Developed by Google, Angular is a widely used framework for building dynamic web applications. It provides comprehensive tools and features for developing scalable and robust applications.
But you must ensure your composable analytics SDK is flexible enough to work with them and that it provides the libraries you need that work directly with these frameworks.
Flexibility is essential because while these UI frameworks provide developers with powerful tools and features to create modern and user-friendly interfaces for their applications, choosing the right one may be based on specific project requirements and choosing a framework that best suits your needs, and it may even change over time, so cross-framework flexibility is vital.
It’s also crucial to ensure it supports modern languages, like TypeScript, that align with contemporary skillsets, and because TypeScipt provides static typing, enhanced tooling, improved error handling, and better code organization for more reliable and maintainable code. But most importantly, it means developers will embrace it.
What to look for:
You’ll want to ensure your composable analytics SDK includes a complete set of client-side libraries and components across UI frameworks. These components must enable developers to build analytics and data-driven experiences into their products using a code-driven approach while using the UI framework they’re familiar with.
For example, Sisense’s Compose SDK comprises various modules, each serving a different purpose. Some of the modules available in the SDK include:
- SDK-UI: This module provides a whole set of React UI components and hooks for rendering charts and executing queries against a Sisense instance
- SDK-UI-ANGULAR: This module offers all the Angular UI components and services you’ll need for integrating Sisense functionality into Angular applications
- SDK-UI-VUE: This module includes comprehensive Vue UI components for incorporating Sisense features into Vue.js applications
Imagine this: no more unwieldy IFrames, and instead, components and modules that empower developers to create customized, integrated data products with composable components. All the classes and components your developers need for dashboards, charts, widgets, queries, and much more, ensuring developers have as much control as needed.
Critical capability #2:
Provides a sandbox to speed developer productivity
Nothing is more painful than learning an SDK by wading through the documentation.
You need an analytics sandbox or free trial to get your project off the ground fast. For example, developers can use a sandbox to prototype and experiment quickly with different visualizations and dashboards to iterate and refine their ideas. They can experiment with different configurations and visualizations, copy and paste code, and try out personalized dashboards and analytics solutions that align with their requirements.
An analytics sandbox is also super valuable for onboarding new developers and getting them up to speed with your composable analytics SDK. For example, it can be a training tool for onboarding new users or educating non-technical stakeholders about data analysis and visualization. They can interact with sample data and pre-built dashboards, enabling them to quickly understand the capabilities and benefits of the embedded analytics solution.

Critical capability #3:
Flexible enough to use third-party visualizations when you need to
While your analytics SDK will no doubt provide built-in charting and visualizations, it’s also essential that it is flexible enough to work with third-party charting libraries like Plotly, MUI Charts, or Chart.js. You don’t want to get chart-locked.
Engineering teams often want to ensure that the analytics platform they use will be able to meet the exact visualization needs of their users, they’ll be able to create their reusable add-ons, and not have to establish code workarounds to support specific chart libraries.
For example, by ensuring your composable SDK integrates with popular charting libraries, you can ensure your in-product analytics supports the broadest range of charting options and gain maximum flexibility for your roadmap. Many developers are already familiar with using established charting libraries like Plotly, MUI Charts, or Chart.js, and your team can leverage their existing knowledge and skills in working with these tools by integrating your composable analytics with them.
These libraries often provide diverse chart types, styles, and customization options, allowing developers to create appealing, tailored visualizations that suit their needs and integrate with UI frameworks such as React, Vue, or Angular.js.

What to look for:
You’ll want to ensure your composable analytics SDK can easily connect to a semantic layer or data model to ensure strong query integrity and performance and abstract your developers from the underlying data source.
With the connection established, it should make it simple to construct a query, providing methods and classes to define the query structure, including selecting data fields, setting filtering conditions, and specifying sorting or grouping criteria. The query capability should also include functions, joins, or aggregation operations.
After the query is constructed, the returned might be in various formats depending on the SDK, such as JSON or CSV, or returned as a data structure depending on the capability of the SDK.
Once you have retrieved the query results, you may perform further data manipulation or transformation to integrate the data with other tools, perform calculations, apply business logic, or visualize the data using charting libraries like Plotly, Chart.js, or MUI Charts. And, of course, you can publish to NPM to create a reusable library.
For example, if you’re using Sisense Compose SDK to integrate with a third-party chart to render a histogram, the steps would be:
- Build query: Query the Sisense to get the minimum, maximum, and number of data points of the data.
- Calculate bin width: Create a list of bins that cover the range of data.
- Build a query with a measure-filter per bin: Execute a query using bin measure-filters to get the frequency data for each bin.
- Process the results: Create chart data from query results.
We’ve made it easy for you to get hands-on and learn how you can integrate a Sisense Compose SDK with a third-party histogram chart. You can check it out here.
Critical capability #4:
Support for advanced analytics like GenAI-powered experiences
In 2024, integrating AI into your app by providing Natural Language Query (NLQ) and conversational analytics is an essential consideration for developers and end users.
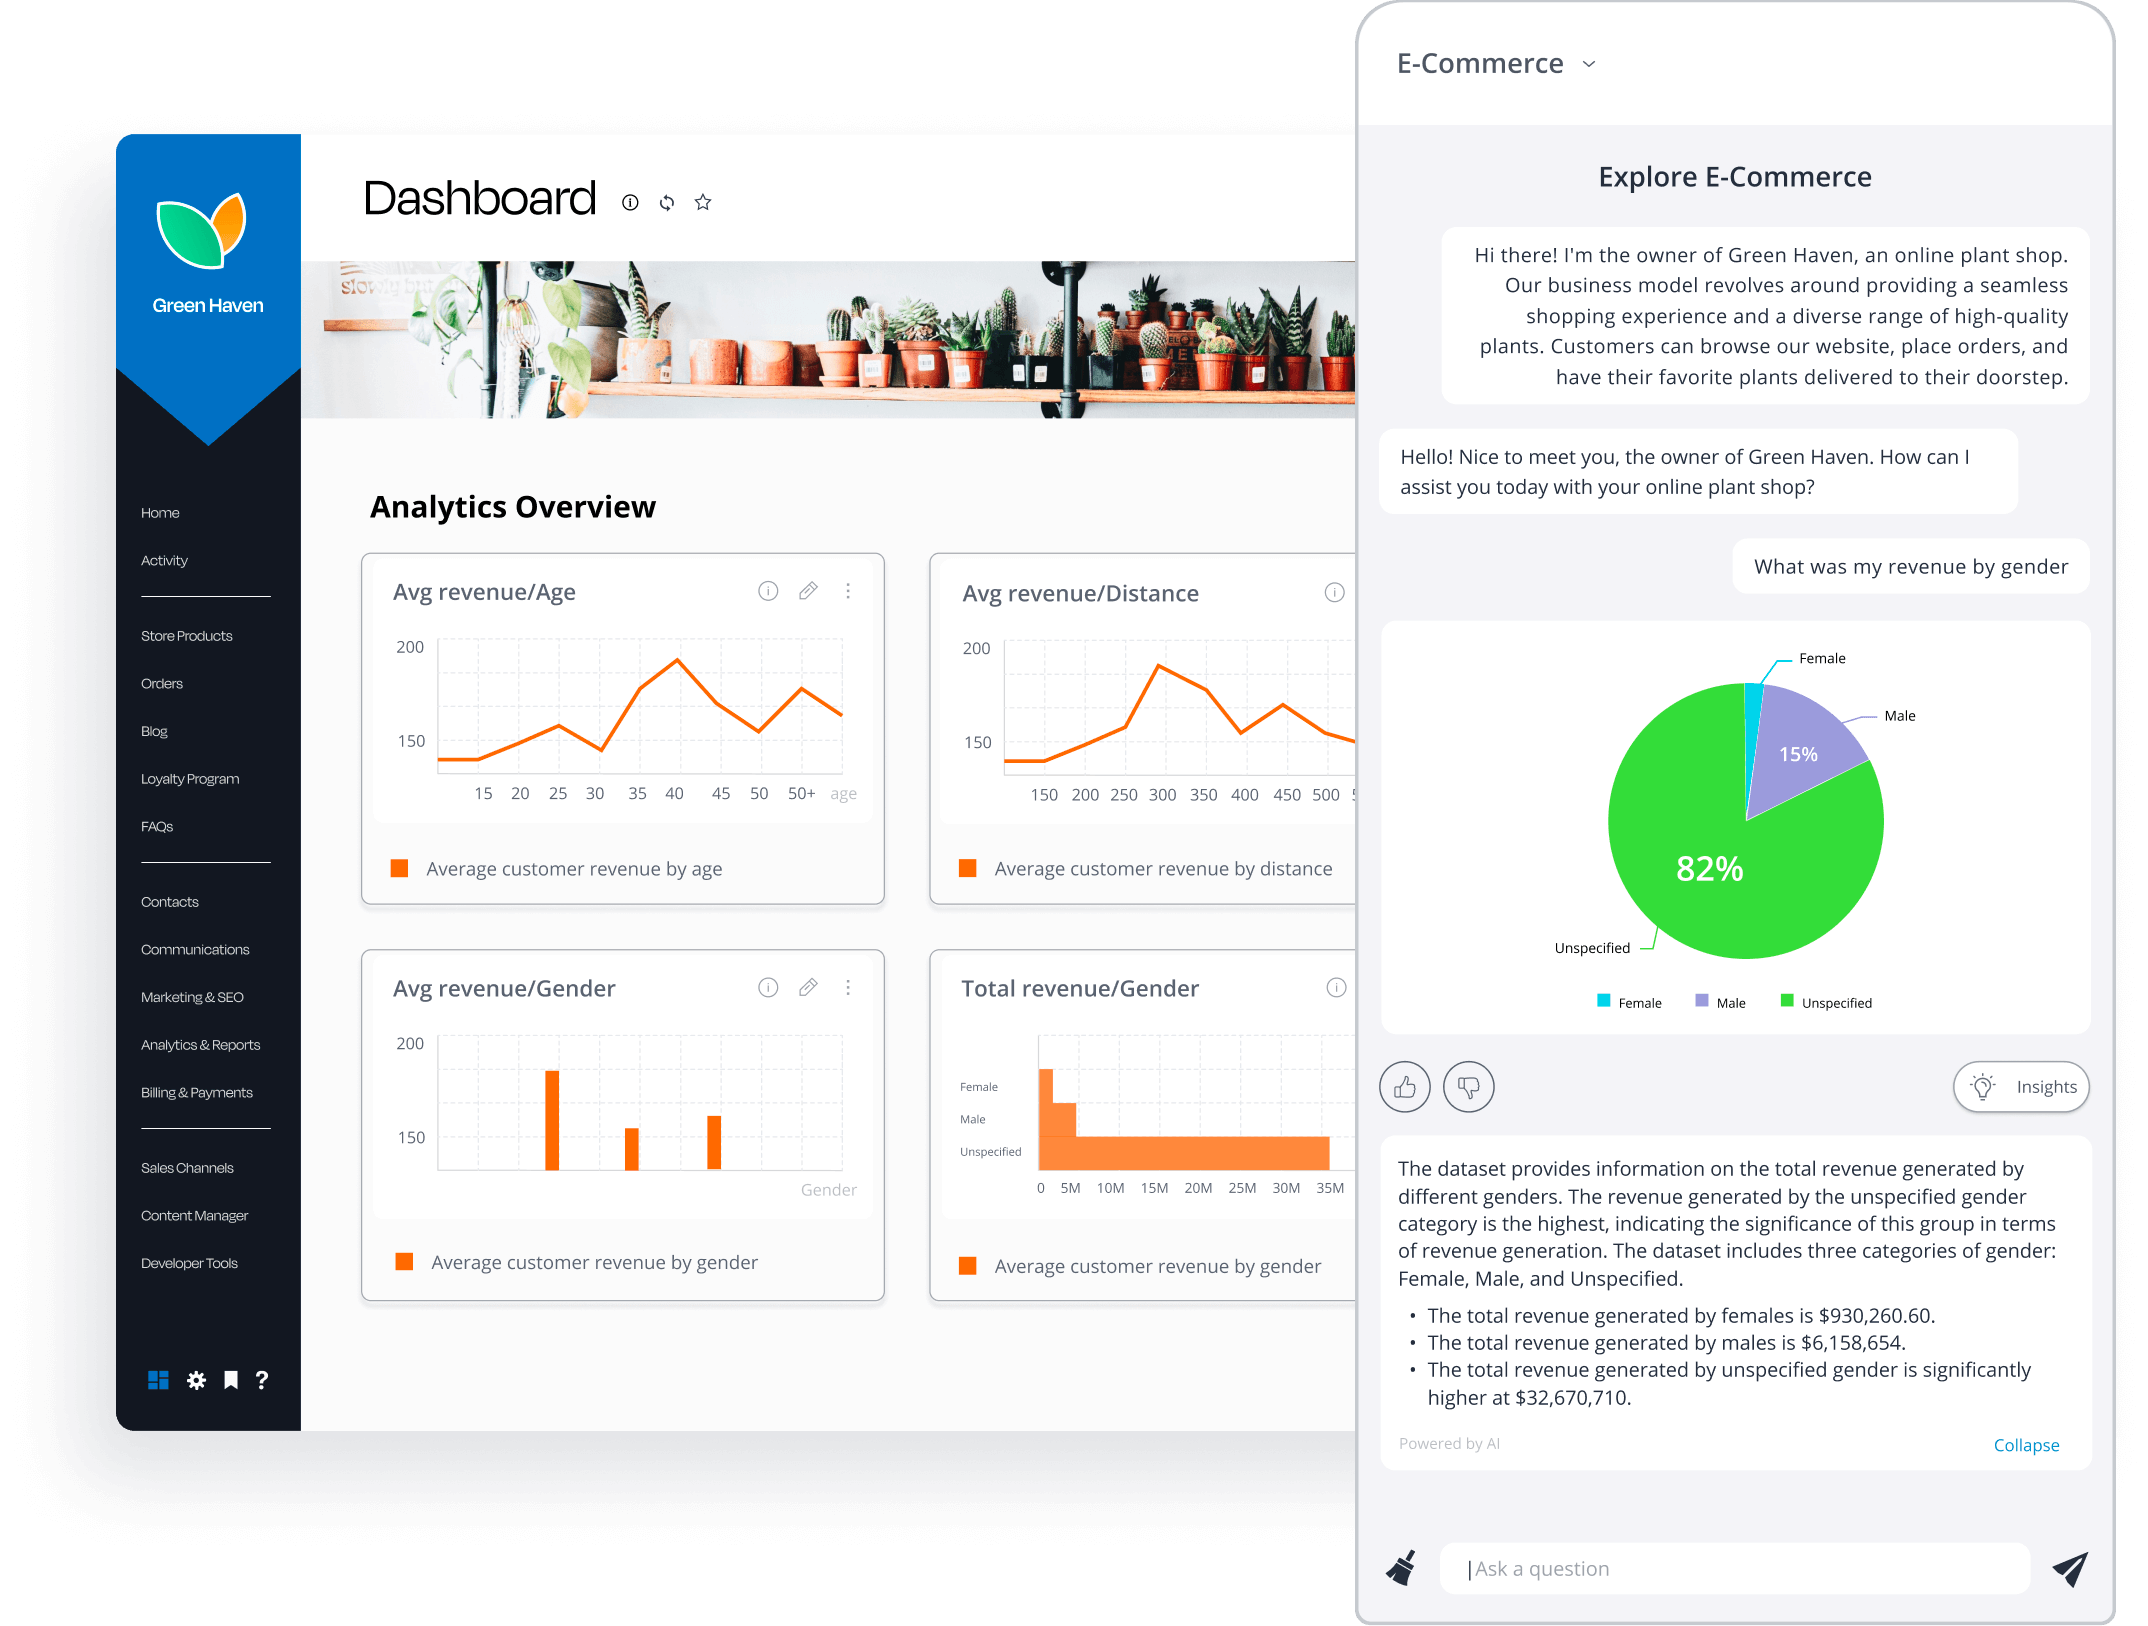
It can allow you to provide your app users with starter prompts in natural language based on their data model. For example, they can ask questions like “What is my revenue by country?” and further explore their analytics by asking about specific fields or requesting explanations of the results. The goal is to offer users a seamless conversational experience centered around their data.
Implementing this functionality can be a complex task that relies on a robust data model for accurate answers and integration with a Large Language Model (LLM). This is where composable development comes into play.
What to look for:
You want control over how you infuse GenAI-powered analytics. For example, Sisense Compose SDK provides an Analytics Chatbot that can be easily embedded into your app. Each component, such as QuickStart questions, Narratives, and Data Topics, is composable and available as a discrete React Component. If you prefer more control, the functionality is accessible through an API to integrate GenAI-powered analytics deeply into your application.

You also want to ensure you have the flexibility of decoupling and abstracting your implementation from a specific LLM provider. Why? Because the LLM you use today may not be the best fit in the future.
Critical capability #5:
Robust scalability and security built into the core
Scalability and security are paramount considerations for composable analytics success. As data volumes continue to grow exponentially and the complexity of analytics processes increases, the ability to ensure strong query performance without heavy operational overhead is critical.
Ensuring the security and protection of sensitive data is always of utmost importance. And because analytics deals with data, security needs are often more complex, as data access must be controlled down to the report, metric, dimension, attribute, row, column, or cell level on a per-user or role-based basis.
What to look for on scalability:
Your composable analytics solution must be able to alleviate the burden on your operations and engineering teams by automatically implementing the latest optimization techniques for each user query. This not only streamlines processes but also leads to cost savings. Choosing a platform that can generate database-dialect-specific SQL code is crucial, ensuring compatibility with your underlying database by utilizing appropriate functions, data types, and optimized query syntax
It must also offer features such as query optimization through pushing queries down to the database. Other capabilities to consider include time series optimization, minimizing table scans, eliminating costly many-to-many joins, and even the opportunity to spin up cached cubes if needed. Automating these processes provides a significant advantage over building your analytics, and helps ensure your development team doesn’t get bogged down in optimization as you grow.

What to look for in security:
The analytics platform you use should meet a broad range of security and compliance standards, such as policies and procedures regarding compliance with SOC 2, ISO 27001, and HIPAA frameworks. If your analytics platform will be processing personal data, consider a platform that has obtained ISO 27701 certification for PII Processors.
As analytics will often be used across your application and in different experiences, you don’t want to be in the business of building analytics security. With composable analytics, user and data-level security should already be built-in, so your development team can avoid creating and maintaining it from the ground up.
But most crucial of all is a strong, flexible semantic layer and underlying data model that enables all the queries your developers or users construct to be routed through it rather than your code querying the data source(s) directly.
This provides numerous benefits. It minimizes the risk of errant queries that risk leaking data. It centralizes logging and audit trails. It enables data-level security to be managed through a single point rather than handled at the application layer, where there may be more risk of data-level security not being applied consistently.
It’s time to embrace composable analytics
You’ve learned how composable analytics provide a powerful way to accelerate analytics delivery infused into your application’s user experience, securely, scalability, and minimizing maintenance.
Take the next step and check out http://sisense.dev, explore Sisense Compose SDK, or talk to one of our experts to learn how to build next-gen data products and insight-driven experiences.


