Unlocking end-to-end AI for analytics: From ML to GenAI
- The AI-powered transformation of analytics
- Embrace the GenAI opportunity
- Laying the foundation with the Sisense Knowledge Graph
- Predicting the future with Sisense
- Ask questions using natural language with Sisense NLQ
- Automating the path to insight
- Leveraging AI to power data preparation
- The future is composable conversational analytics
- From ML to conversational, it's time for end-to-end AI-driven analytics
The AI-powered transformation of analytics
Artificial Intelligence (AI) and Machine Learning (ML) have already brought about a seismic shift in the field of analytics, revolutionizing how data is processed, analyzed, and leveraged to drive business outcomes. For product teams, adding analytics to their apps and ensuring the analytics experience is infused with AI/ML provides predictive and prescriptive insights is already the key to fostering both user engagement and driving actionable analytics.
But now the emergence of Generative AI (GenAI) and Generative Pre-trained Transformers (GPT) has further elevated the potential for AI to unlock the next level of value from analytics by harnessing the power of Large Language Models’ (LLMs) probabilistic and deep learning models to deliver conversational analytics experiences.
Even prior to the advent of GenAI, traditional AI and ML used in tandem with analytics have enabled product and analytics teams to deliver deeper insights and facilitate stronger decision-making processes. AI and ML algorithms are highly effective at predicting future outcomes based on historical data patterns. Predictive analytics can forecast trends, anticipate customer behavior, optimize resource allocation, and mitigate risks. These predictions enable proactive decision-making, leading to better business outcomes.
Natural Language Processing, a branch of AI, has long been part of analytics systems such as Natural Language Query (NLQ), allowing users to find specific data, reports, or insights seamlessly. Organizations are leveraging AI and ML to help streamline the data processing and analysis workflow by automating repetitive tasks such as data cleansing, transformation, and aggregation, reducing the burden on data analysts, saving time, and minimizing the risk of human error.
Yet this is just the beginning of AI transforming analytics.
Embrace the GenAI opportunity
GenAI opens up a new avenue of opportunity: conversational analytics. Your customers and users will expect Generative AI-powered analytics capabilities in the apps you’re building and delivering. If you don’t deliver it, your competitors will.
Because LLMs excel at understanding and contextualizing user inquiries, they can provide a more intuitive and user-friendly interface for interactions with analytics. Instead of navigating through complex dashboards or writing specific queries, users can have an ongoing conversation with the AI to access the desired information, from asking questions to explaining answers. However, the key to success is not only providing a chat-based experience, but also leveraging the power of GenAI throughout your analytics engine, and ensuring that it’s highly integrated into your products using composability. Additionally, you should expect conversational answers to come with minimal risk of hallucinations, and issues such as data privacy and security, robustness and reliability, and regulatory and legal issues should be taken into consideration.
What you’ll learn
In this paper, you’ll learn the scope of AI and ML that Sisense Fusion provides and why it’s important for you, from knowledge graphs to predictive analytics, NLQ, and AI-powered data preparation. We’ll dive deep into data storytelling and narratives, ways to identify anomalies and patterns, the power of exploration paths, and root cause analysis.
You’ll find out how Sisense is designed to enable you to effortlessly connect to a spectrum of AI and Data Science/Machine Learning (DS/ML) tools, including LLMs, through its powerful, AI-agnostic architecture. And we’ll share how composability enables you to infuse AI into your product and user experiences, starting with GenAI-powered conversational analytics, so your developers can weave it into your products.
All of this will give you ideas on how to accelerate AI-powered analytics in your roadmap, including Generative AI-powered conversational analytics, and the opportunities to deliver powerful new value to your users.
It’s time to learn how Sisense is leading the charge in every aspect of AI-powered analytics. Let’s get started.

Laying the foundation with the Sisense Knowledge Graph
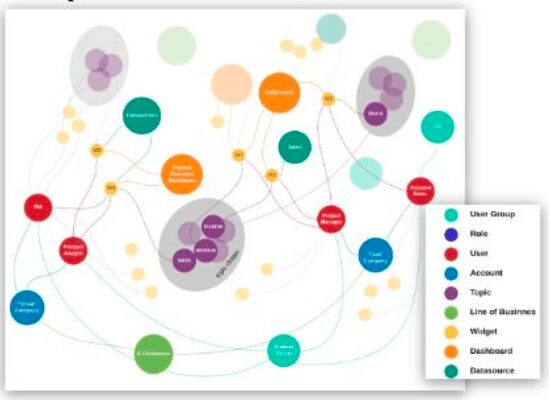
Unlike traditional platforms, Sisense Fusion incorporates an AI Knowledge Graph at its core. AI knowledge graphs are a critical foundation for advanced business intelligence. The Sisense Knowledge Graph captures a user’s analytic inquiries and their usage, to understand what users are asking and what they find interesting.
In a nutshell, knowledge graphs capture relevant searches and seamlessly aggregate query usage in a way that’s easy to analyze, essentially serving as a form of organizational memory. For example, in every organization, people change their roles or move on, and new people interact with the data. Knowledge graphs can enable new users to get recommendations based on what their predecessors and others in their user group asked, so the knowledge of any previous data searches isn’t lost and can inform recommendations.
The patented Sisense Knowledge Graph that underlies many of the AI and ML investments throughout our platform essentially “studies” the associations between all entities on the system (users, data, models, widgets, formulas, clicks, filters, and more) to assemble the collective wisdom of the organization, leading to more “human” and context-aware outcomes from our AI engine. This jumpstarts the delivery of relevant, powerful, and context-based insights. Recommendations that deliver different perspectives and views of a user’s interests are enhanced by the usage pattern of all other users in that system, from data modeling to analytics.
Predicting the future with Sisense
Sisense Forecast and Sisense AI Trends are advanced, ML-powered forecasting and trend functionalities that can be applied via a simple menu option to any visualization based on time-series data including line, area, and column. The two are complementary features; Sisense Forecast allows us to see predictive movements in the future, whereas AI Trends shows what’s happened in the past.
For example, Sisense Forecast and AI Trends can be used to:
- Forecast demand patterns, enabling businesses to optimize inventory levels and reduce carrying costs in logistics and inventory.
- Identify customers most likely to churn, allowing businesses to proactively engage and retain them.
- Estimate future sales based on past data, customer behavior, and market trends, allowing businesses to set realistic targets and allocate resources efficiently.
- Predict the potential impact of different marketing strategies, helping businesses allocate people and marketing budget more effectively.
- Forecast future cash flows based on historical data, market trends, and other factors, allowing finance teams to identify potential cash shortages and take proactive measures to improve cash flow, such as reducing expenses or increasing sales.
See what’s next with Sisense Forecast
With Sisense Forecast, Business Analysts can confidently forecast future values and achieve advanced forecasting capabilities using menu-driven, point-and-click capabilities that allow business users to discern trends and patterns in data immediately.
Sisense Fusion is one of few platforms able to automatically create univariate and multivariate forecasts of continuous variables in a dataset, and offers a point-and-click, no-code workflow for business users to apply advanced forecasting predictions using an AutoML approach. Sisense Fusion has the following built-in models: Auto Arima, Prophet, Random Forest, Holt-Winters, Boost Spline, Ranger (Random Forest), XGBoost, CatBoost and ElasticNet.
In addition, advanced users can create and apply custom models. Models can be applied during data transformation or when rendering data visualizations and can use Sisense’s built-in AutoML engine, customer-supplied R or Python scripts, or third-party forecasting services accessible via API. Forecasting is an advanced capability that is highly valued by OEMs for its differentiation in their own products. With Sisense, users can use an ensemble approach that leverages AutoML to automatically decide on a weighted solution.
- Business analysts can choose from an ensemble of univariate and multivariate forecasts on any time series visualization (Line chart, Area chart, Column chart). In the univariate forecast, the analyst can select a specific forecasting model for the analysis in addition to the ensemble.
- Sisense’s AI engine selects the most effective ensemble configuration, based on the best from the underlying data model.
- Business users can confidently compare forecast values and actual values for the last period, as well as change the forecast period according to their preferences. Statistical outputs on each forecast model are available from the menu to increase explainability and trust in the forecast.
- The dashboard designer can control each widget if the forecasting feature is exposed.


Identify anomalies and patterns with AI Trends
With Trends, users can add another layer on top of their visualizations to highlight the trends in the data and make these trends easier to consume. Users can easily draw trend lines using a number of statistical algorithms, including exponential smoothing and local estimates. Compare trends with previous or parallel periods.
Sisense supports trend lines on all Column, Line, Area, and Bar charts. Both Dashboard Designers and Viewers can interact with an “Analyze It” button to apply trend lines, and admins can enable and disable trend types based on cloud models from the Admin page.


| Want to get started with AI for analytics today? Apply now to become a beta partner of Sisense’s GenAI components—including conversation analytics capabilities, natural language generation narratives, and our Analytics Chatbot. |
Ask questions using natural language with Sisense NLQ
Sisense has made continuous investments over the past years around Natural Language Processing, even before the advent of GenAI. You’ll learn what Sisense delivers with NLQ today, and at the end of this paper, we’ll drill into what we’re delivering using composable conversational analytics, so you can infuse natural language into your own applications.
NLQ enables users to ask sophisticated questions in an easy way with natural language, and this is where Sisense’s powerful NLQ feature, “SimplyAsk,” comes into play. Users can ask any question, going beyond any predefined widget or visualization created by the dashboard designer. Clicking the ‘SimplyAsk’ button, the user types a question, gets automatic suggestions, and immediately sees an appropriate visualization, with full support for spelling mistakes, synonyms, and ambiguity.
With Designer privileges, users can leverage SimplyAsk to create reports from scratch using only the business questions relevant to them. When activated, your customers can log in to your application, select a dataset, ask questions in natural language, choose visualization preferences, and add the results to their new report. They can also share their created reports and the insights they’ve gained with others.
Using plain language, you can ask complex questions and receive immediate visualizations with answers. The tool’s auto-suggestions streamline query building through Sisense’s unique Knowledge Graph—a resource that uncovers connections between system entities to provide comprehensive organizational insights. This leads to context-aware responses from the Sisense AI engine that resemble human-like interactions. Security remains a priority; users can access only authorized data, while universal suggestions enhance usability. By enabling SimplyAsk through Sisense’s Admin tab, you can witness your queries transforming into actionable insights.
How does SimplyAsk interpret my intentions?
The NLQ engine’s Synonym Translation offers seamless query refinement. When you input a term that’s not part of the data model, the engine’s built-in English synonym dictionary, along with your data’s terminology, automatically translates it into a relevant synonym found within the model (e.g., income/revenue, nation/country)– this ensures precise results. Additionally, for terms not directly synonymous with the dictionary, you have the option to enhance accuracy by adding them as synonyms within the model.
By integrating SimplyAsk, organizations open doors to unprecedented user experiences—users can log in, pose questions in plain language, visualize answers, and craft custom reports to share with others. The foundation of SimplyAsk lies in its ability to comprehend nuanced queries and translate them into visualizations, backed by Sisense’s exclusive Knowledge Graph. Activating SimplyAsk unleashes a transformation, where queries evolve into actionable insights, propelling your analytics experience into the future.
Getting answers using Natural Language Generation with Sisense Narratives
Sisense Narratives leverages natural language generation (NLG) technology to automatically create text-based insights that describe the most important points in a visualization.
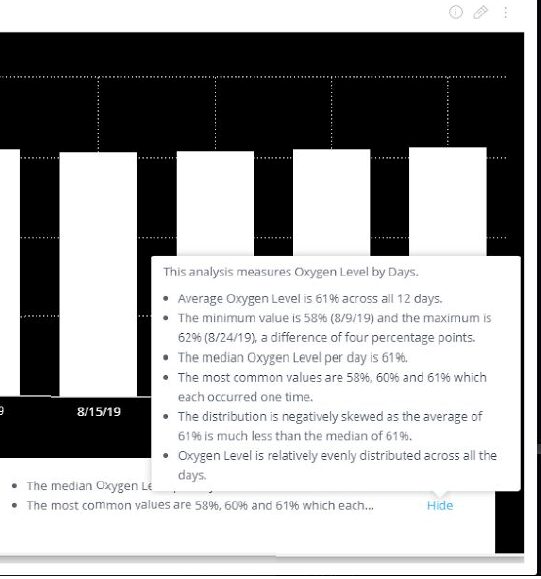

NLG is particularly important because it not only helps a user to understand the key points, but it can also help users improve their data literacy as they match the text with what they’re seeing in the chart.
Automating the path to insight
Driving the adoption of analytics within organizations is often hindered by a lack of data acumen within the general user population. Users either lack the technical skill or the time to traverse the data and create the content of their own, leaving the ‘job’ of analytics to a relatively small number of overtasked key resources. AI can bridge this gap in two ways. First, by automating data analysis and content creation, Sisense makes it easier to create meaningful content. And, by providing a guided experience Sisense makes it easier for even novice users to gain a deeper understanding of their business.
Discover the “Why” with explanations and key driver analysis
When you see a spike or sudden decrease in your data, you want to find the root causes that contributed to that behavior to help you react accordingly and plan ahead. Sisense aids in the exploration process by highlighting anomalous data points and breakpoints through the utilization of our anomaly detection and breakpoints services. Manually seeking the key drivers is time-consuming and ineffective. You would need to drill down into different fields (a.k.a. “dimensions”) or meet with people in your organization to find the reasons for the behavior in your data. You would also have to come up with hypotheses for the explanations you want to investigate further. Aside from the time this takes, this method is error-prone and there may be things that you have not thought about.
The Explanations capability automatically identifies the most probable key drivers for a given change in your data. It covers hundreds of possible contributing factors and presents the top ten fields (or combinations of fields) that contributed most significantly to the change in behavior between the selected point and a previous point. You can explore these fields to see what effect they have on your data. This helps you get the answers you need inside Sisense Fusion and enables decision-makers to easily understand connections and root causes in their Key Performance Indicators (KPIs).
To find the root causes or possible contributing factors to a KPI (Measure), Explanations analyzes a larger data set that is enriched with additional fields from the data model/dashboard. They are retrieved from Sisense’s Knowledge Graph and are based on both prior analyses/queries performed on the system as well as enrichment of other fields from the model.


Understand relationships with AI Exploration Paths
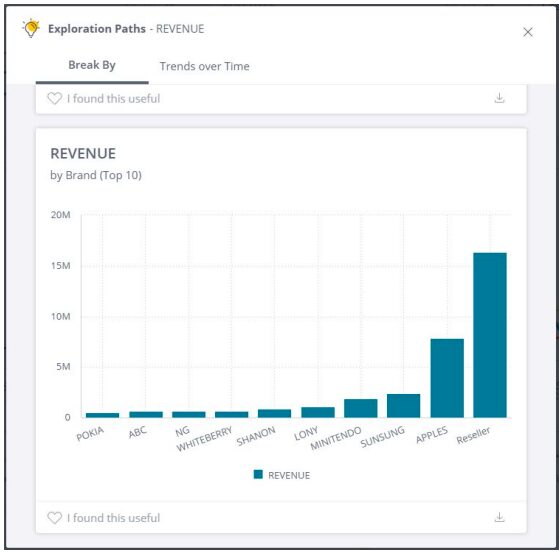
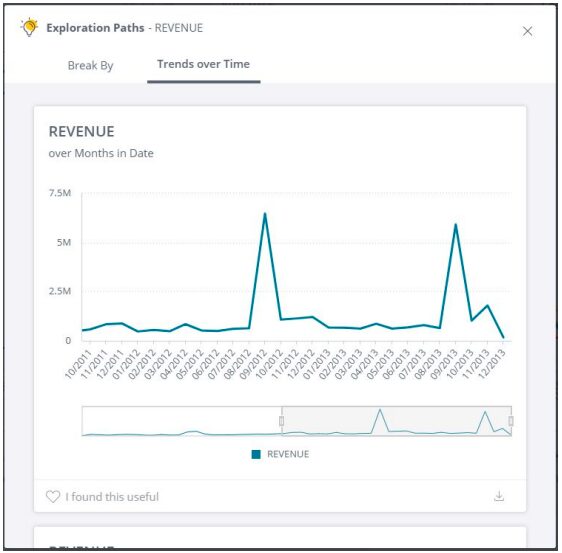
Sisense’s Exploration Paths automatically generates visualizations that explore relationships relating to user KPIs. The AI engine uses a Pointwise Mutual Information based algorithm to automatically identify associations in the data model. Because Sisense leverages the same data models for many use cases, our AI engine can learn from all usage patterns from all users of the data, not just those from that particular app.
Unlock anomaly detection with Sisense Pulse
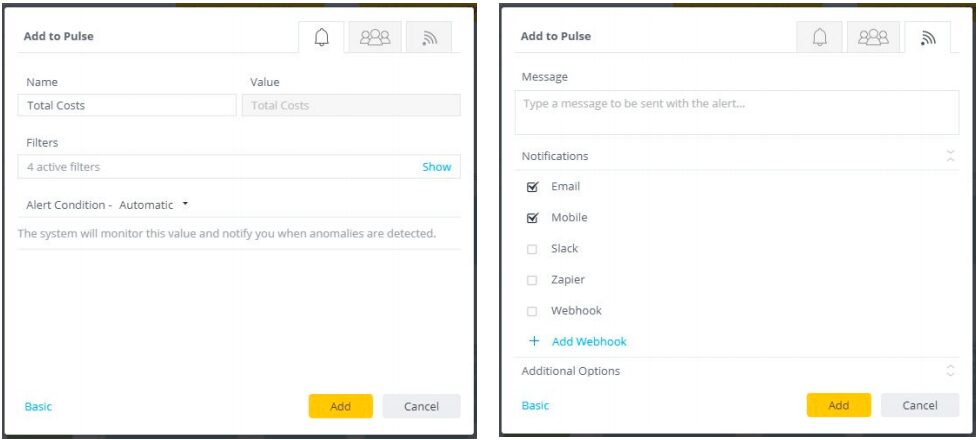
Sisense Pulse continuously analyzes KPIs that have been identified by a user using multiple advanced models developed by our internal data science team. When outliers are detected, the system alerts the user automatically via a combination of email, the Sisense Mobile App, or any channel. This is accomplished without the need to configure any threshold or rule.
Leveraging AI to power data preparation
Sisense provides an easy-to-use environment for working with large disparate data sets. Users can use ready-made point-and-click options or Excel-like functions to transform their data. However, preparing complex and large data sets for analysis can be cumbersome. AI-assisted Data Prep capabilities within Sisense are focused on reducing the most time-consuming tasks to prepare and model data for analysis. The technical acumen required for data preparation is also lowered, allowing for the expansion of capabilities and responsibilities to more widely available skill sets — such as business analysts.
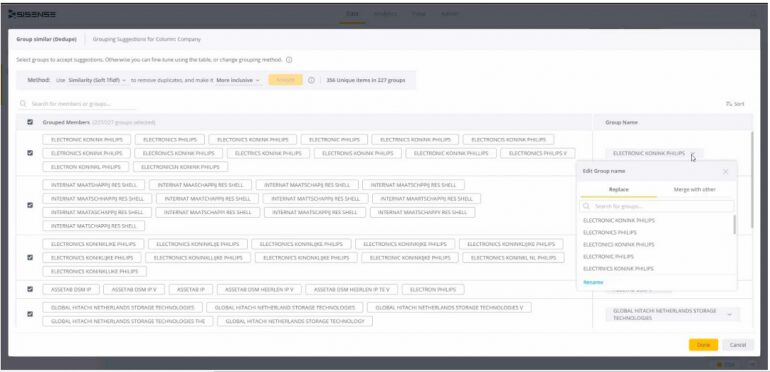
Augment data prep with Group Similar (Dedupe)
The AI-powered Group Similar capability is an augmented data preparation capability that automatically unifies similar values within a given column that are likely the same (i.e. USA, US, United States) and groups them with a few clicks without the need to compose individual structured query language (SQL) expressions. Group Similar has default parameters that generate the model on the fly based on similarity functions and sensitivity parameters. The intelligent and intuitive user interface significantly reduces the complexity and time required to group similar values.
Use custom code to achieve limitless AI integrations
Sisense enables data modelers to complete comprehensive data transformation and enrichment, all as part of the analytics lifecycle. In fact, a full range of data transformations can all be used to facilitate the data preparation process, all directly in the product.
Sisense can be used to connect end-users in application environments with augmented insights generated by data science teams and through third-party ML services. For example, data from Sisense can be sent to an AutoML platform such as AWS Comprehend or Sagemaker to leverage other non-AWS AI services. You can transform your data by leveraging advanced ML models, either proprietary or from third-party sources, also directly from within the platform. Data modelers can use preset no-code solutions or choose from existing libraries. Sisense also supports user-defined Python Jupyter notebooks.
Sisense also provides examples from AWS, but it’s important to remember that the functionality is completely cloud-agnostic.


The future is composable conversational analytics
2023 has seen the emergence of a new way to bring the power of GenAI-powered analytics directly into your product with ease, with our new composable Analytics Chatbot. Earlier in 2023 Sisense launched Compose SDK to enable software engineers and developers to integrate and embed analytics capabilities powered by Sisense Fusion into any web application, utilizing modern frameworks such as React and TypeScript, or their preferred alternatives. Its composable and modular design ensures developers can add analytics in a flexible and versatile manner to suit their specific needs.
In 2024, we’re expanding Compose SDK to make enable product teams to seamlessly add conversational analytics powered by GenAI into their products and completely embed it into their user experience and workflows.
Think of the Analytics Chatbot as an embeddable LLM-powered sidekick, a whole chatbot experience you can rapidly add to your app with complete control. It’s provided as a React Component and enables your users to begin their conversation with pre-generated QuickStart natural language questions if they prefer or begin with their own specific questions. The Analytics Chatbot will make it simple for your users to ask questions around the data model, such as fields and metrics they can query, ask analytics questions, get visual answers, or generate detailed narratives for data storytelling based on results.


Modular composability for conversational control
In fact, because Compose SDK is composable from the ground up, every conversational aspect is available with support for React Component, including QuickStart questions, Narratives, and Data Topics (that enable users to select a data model to converse with). And, of course, all of the functionality is available as an API if you’re looking to embed GenAI-powered analytics deep into your application.
Trusted GenAI support
It may seem common sense that for your users to confidently act on the GenAI-powered analytics answers they get from your application, they must trust that those answers actually answer the question. But it’s a crucial factor as you build out your roadmap around conversational analytics. It’s why all of the GenAI capabilities we’ve built into Compose SDK are created on top of the Sisense data model, our semantic layer. It gives your analytics team the control to ensure that questions are turned into the appropriate queries and form analytics answers to the corresponding narratives. The Sisense data model includes fields, metrics, formulas, and relationships and is all governed by centralized row and column-level security, so everyone is chatting with the same, managed single version of the truth.
Sisense offers the option of using the Analytics Chatbot with its license key for Azure OpenAI Services, GPT-family models. Alternatively, if your organization is running its own OpenAI instance or a different third-party GenAI instance, you can provide your own GenAI license key to ensure that conversations are private to your instance.
Create an agile GenAI and analytics roadmap
Whether you start with OpenAI today, are looking to perhaps bring your LLM in-house in the future, or even considering switching gears to LLaMa 2, it’s important to be able to plug and play as new LLMs or compliance needs emerge. In just the same way that Sisense is cloud and database agnostic, whether you want to run Sisense on AWS, Azure, or GCP or use RedShift, Google BigQuery, or another database for analytics, we’re designing Compose SDK’s GenAI capabilities to be LLM fluid too. We aim to enable you to deliver the best GenAI-powered analytics experience while ensuring complete back-end and architecture flexibility, from database to LLM. It means you can build for today but embrace what tomorrow will bring.
From ML to conversational, it’s time for end-to-end AI-driven analytics
It’s never been more important to add the full breadth of AI-powered analytics to your products and user experience. Your customers and users expect AI in your product roadmap. AI is no longer optional, it’s mandatory and critical to competitive advantage and user engagement. Sisense is committed to enabling you to accelerate your path to infusing your product with AI-powered analytics.
Sisense Fusion’s end-to-end AI and composable development makes it easy to integrate AI into your users’ workflows, from predictive analytics to prescriptive recommendations to conversational analytics.
The secret isn’t purely AI functionality, it’s composable development. Because AI has to be a natural part of users’ workflows to drive engagement, composability enables developers to leverage APIs and web components to infuse AI directly into their applications and products, with complete programmatic control.
Now, with the new Sisense GenAI-powered composable Analytics Chatbot, adding intuitive conversational analytics experiences in-app is a breeze. Analytics Chatbot provides the most natural experience for your users to explore data, ask questions, and gain narrative answers, all driven by the latest in GenAI.
It’s time to start your journey and infuse AI-powered analytics into your product and user experience. Book a demo and speak with a Sisense expert to take the next step. And apply now to become a beta partner of Sisense’s GenAI components—including conversation analytics capabilities, natural language generation narratives, and our Analytics Chatbot.
1 US Patents: US-11698918-B2 | System and method for content-based data visualization using a universal knowledge graph; US-11663498-B2 | System and method for generating organizational memory using semantic knowledge graphs; US-11687553-B2 | System and method for generating analytics insights utilizing a semantic knowledge graph. 3 issued, 2 pending


